柱状图
🔖 python
🔖 visualization
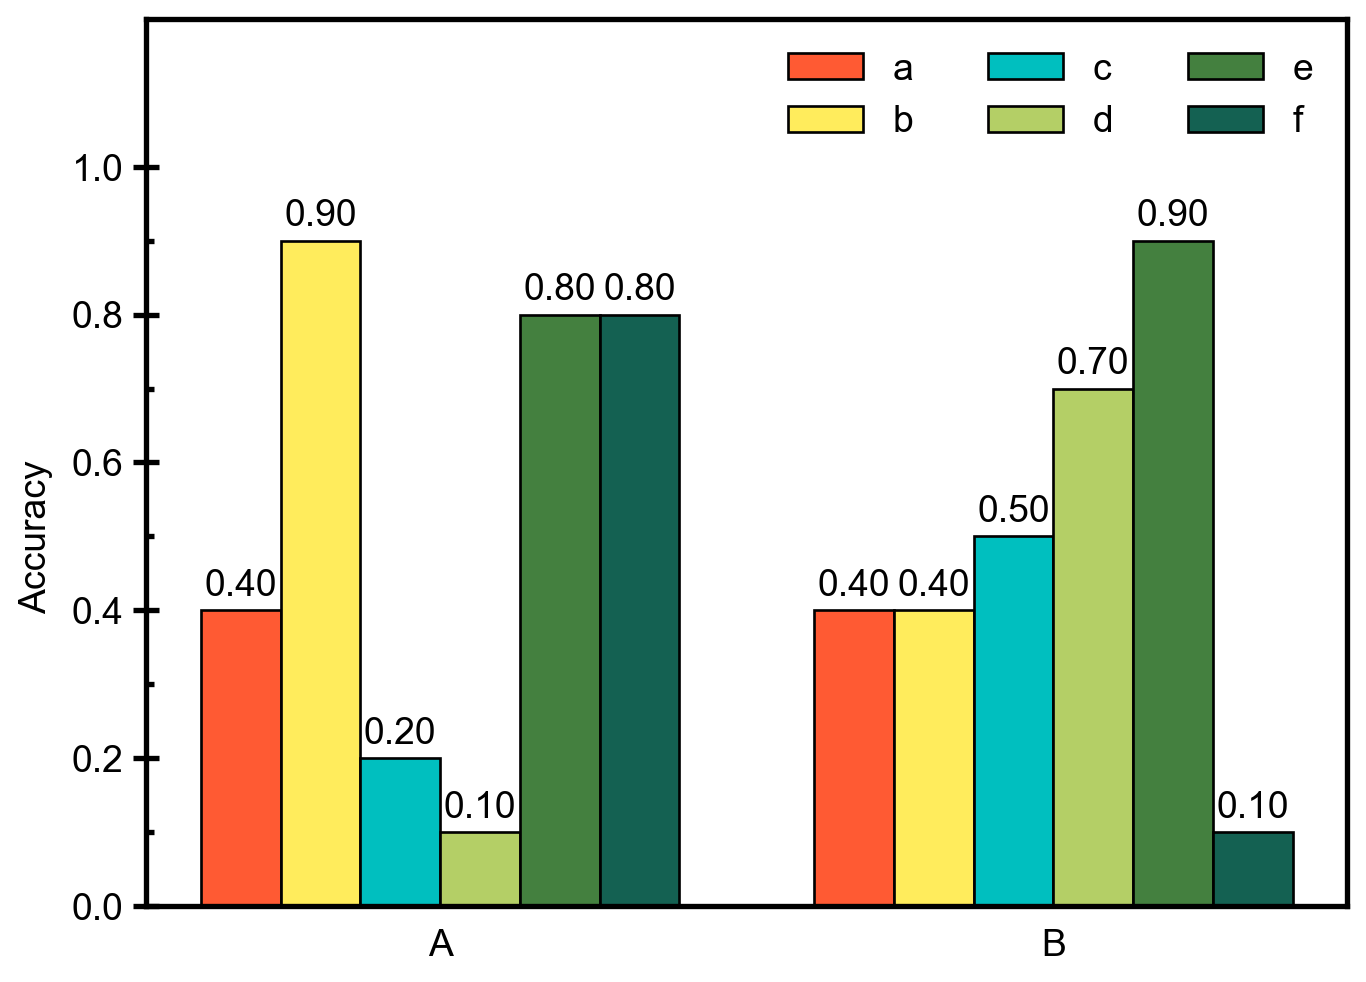
1 双排
color_li = [
    "#FF5A33",
    "#FFEC5C",
    "c",
    "#B4CF66",
    "#44803F",
    "#146152",
]  # bar color

fig = plt.figure()
ax1 = fig.add_subplot(111)
width = 0.13  # 柱状体宽度
x = np.arange(dataset_2.shape[1])  # 定位柱状体位置
for i in range(dataset_2.shape[0]):
    tmp = ax1.bar(
        align="edge",  # 对齐标准
        width=width,
        x=x + i * width,  # 柱状体宽度为 width,所以要增加偏离
        height=dataset_2.iloc[i, :],
        color=color_li[i],
        edgecolor="k",
        label=dataset_2.index[i],
    )
    ax1.bar_label(tmp, fmt="%.2f", padding=3)  # 柱状图标签

ax1.set_ylabel("Accuracy", position=(0, 0.5 / 1.2), ha="center")
ax1.set_ylim(0, 1.2)
ax1.legend(ncol=3)
ax1.tick_params(axis="both", which="major", direction="inout")
ax1.tick_params(which="both", bottom=False)

ax1.set_xticks(x + width / 2 * dataset_2.shape[0],
               dataset_2.columns)  #! 注意表达技巧
locator_major = plt.FixedLocator(locs=np.arange(0, 11, 2) / 10)  # y の主目盛
locator_minor = plt.FixedLocator(locs=np.arange(1, 10, 2) / 10)  # y の副目盛
ax1.yaxis.set_major_locator(locator=locator_major)
ax1.yaxis.set_minor_locator(locator=locator_minor)