Matplotlib的Artist
1 面向对象的 API 接口
这是最为推荐的风格,一般以 fig, ax = plt.subplots() 或其它等价的语句开头,后跟 ax.plot(), ax.imshow() 等。实际上,这里的 fig 和 ax 就是 Artist。下面是几个最简单的例子:
有些教程会用 fig = plt.gcf()和 ax = plt.gca(),当你从 Pyplot 接口切换到面向对象接口时确实应该这么写,但有些纯 Pyplot 风格的代码里还写些无意义的 ax = plt.gca() ,这显然是无脑从面向对象代码里抄过来的。如果有意切换接口,那么使用 plt.gcf() 和 plt.gca() 并不是什么坏事。考虑到隐式切换可能会迷惑初学者,绝大部分情况下从一开始就显式地使用 plt.subplots() 或 fig.add_subplot() 就是最好的做法。
2 Pyplot
这是一种 matlab 用户熟悉的画面:
# https://matplotlib.org/stable/tutorials/introductory/pyplot.html
def f(t):
    return np.exp(-t) * np.cos(2 * np.pi * t)


t1 = np.arange(0.0, 5.0, 0.1)
t2 = np.arange(0.0, 5.0, 0.02)

plt.figure(1)
plt.subplot(211)
plt.plot(t1, f(t1), "bo", t2, f(t2), "k")
plt.tick_params(axis="both", which="major", direction="inout")

plt.subplot(212)
plt.plot(t2, np.cos(2 * np.pi * t2), "r--")
plt.tick_params(axis="both", which="major", direction="inout")
plt.show()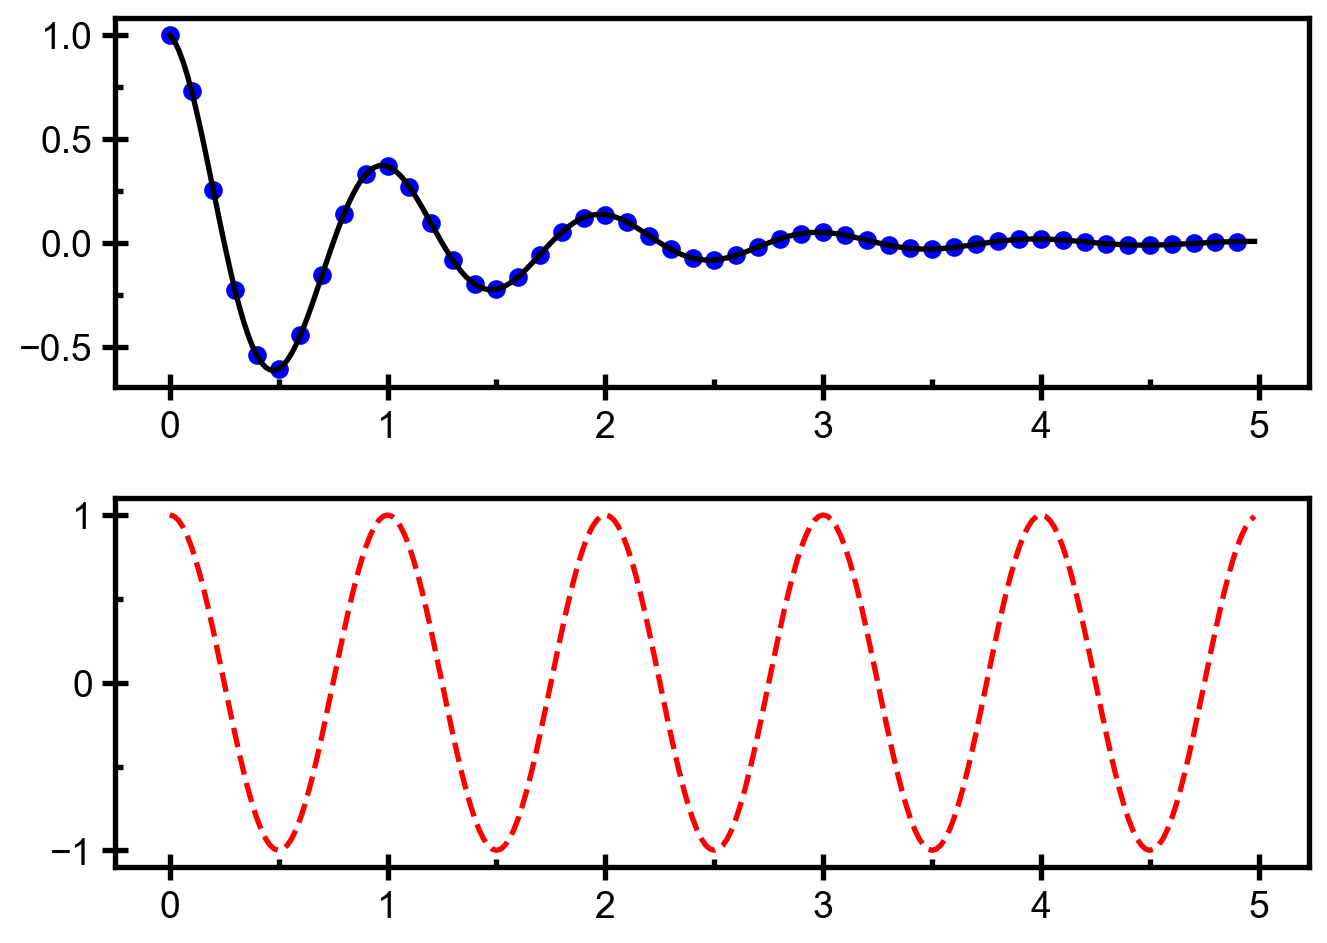
刚开始的时候你可能会觉得这种风格非常简单,因为不需要考虑你正在操作哪个对象,而只需要知道你正处于哪个”状态”,因此这种风格又被称作”状态机”。这里”状态”的意思是目前你在哪张图(figure)和哪张子图(subplot)里。正如你在 Pyplot tutorial 里看到的,如果你的图不是很特别复杂的话,这种风格能给出不错的效果。虽然 Pyplot 接口提供了许多函数来设置图片,但你可能不到一会儿就会发现这些功能还不够用,具体时间取决于你想要的效果,也许不到几小时、几天、几个月就会这样(当然运气好的话你不会碰到问题)。到了这一阶段你就需要转到面向对象接口了,这也是我推荐从一开始就使用面向对象接口的原因之一。不过当你需要快速验证或只想画点草图时,Pyplot 还是有挺有用的。
3 Matplotlib
在网上搜索几次后,你会注意到 matplotlib 有一个层级结构,由通常叫做 fig 和 ax 的东西组成:
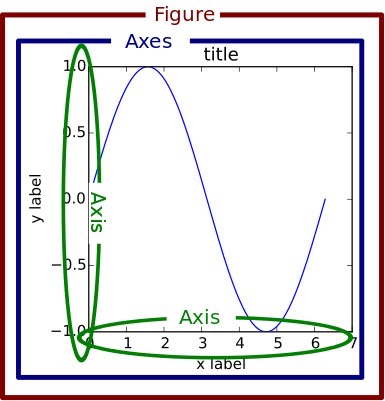
实际上,图中这三个组件是被称为”容器”的特殊 Artist(Tick 是第四种容器),我们后面还会再谈到容器。透过这种层级结构,前面举的简单例子会显得更加清晰:
进一步查看 fig 和 ax 的属性能加深我们对层级结构的理解:
fig = plt.figure()
ax = fig.add_subplot(1,1,1) # 创建一个空的绘图区域
ax.tick_params(axis="both", which="major", direction="inout")
print('fig.axes:', fig.axes)
print('ax.figure:', ax.figure)
print('ax.xaxis:', ax.xaxis)
print('ax.yaxis:', ax.yaxis)
print('ax.xaxis.axes:', ax.xaxis.axes)
print('ax.yaxis.axes:', ax.yaxis.axes)
print('ax.xaxis.figure:', ax.xaxis.figure)
print('ax.yaxis.figure:', ax.yaxis.figure)
print('fig.xaxis:', fig.xaxis)
fig.axes: [<matplotlib.axes._subplots.AxesSubplot object at 0x1167b0630>]
ax.figure: Figure(432x288)
ax.xaxis: XAxis(54.000000,36.000000)
ax.yaxis: YAxis(54.000000,36.000000)
ax.xaxis.axes: AxesSubplot(0.125,0.125;0.775x0.755)
ax.yaxis.axes: AxesSubplot(0.125,0.125;0.775x0.755)
ax.xaxis.figure: Figure(432x288)
ax.yaxis.figure: Figure(432x288)
--------------------------------------------------------------------------------
AttributeError                            Traceback (most recent call last)
<ipython-input-21-b9f2d5d9fe09> in <module>()
      9 print('ax.xaxis.figure:', ax.xaxis.figure)
     10 print('ax.yaxis.figure:', ax.yaxis.figure)
--------> 11 print('fig.xaxis:', fig.xaxis)

AttributeError: 'Figure' object has no attribute 'xaxis'
根据这些结果我们可以归纳以下几条关于 Figure、Axes 和 Axis 层级结构的规则:
Figure知道Axes,但不知道Axis。Axes同时知道Figure和Axis。Axis同时知道Axes和Figure。Figure可以容纳多个Axes,因为fig.axes是一个由Axes组成的列表。Axes只能属于一个Figure,因为ax.figure不是列表。- 基于类似的理由,Axes 只能有一个
XAxis和一个YAxis。 XAxis和YAxis只能属于一个Axes,因而也只能属于一个Figure。
4 图中一切皆为 Artist
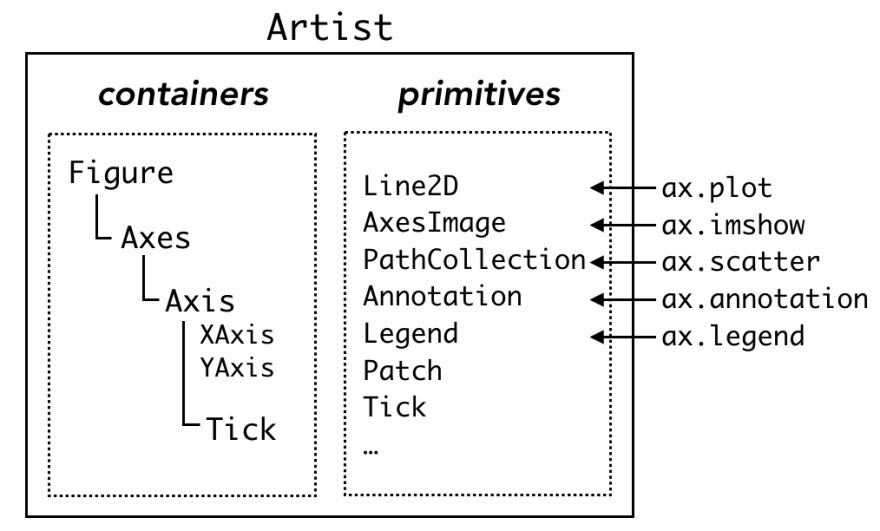
目前 Usage Guide 里并没有放解释层级结构的图,而是放了一张名为”剖析一张图(Anatomy of a figure)“的示意图,同样信息量十足,阐述了一张图所含的全部组件。
从代表数据的线条和点到 X 轴的小刻度和文本标签,图中每个组件都是一个 Artist 对象。Artist 分为容器(container)和图元(primitive)两种类型。正如我在上一节写到的,matplotlib 层级结构的三个组件——Figure、Axes 和 Axis 都是容器,可以容纳更低一级的容器和复数个图元,例如由 ax.plot 创建的 Line2D、ax.scatter 创建的 PathCollection,或 ax.annotate 创建的 Text。事实上,连刻度线和刻度标签都是 Line2D 和 Text,并且隶属于第四种容器 Tick。
容器有许多存放各种图元的”盒子”(技术层面上就是 Python 列表),例如刚实例化的 Axes 对象 ax 会含有一个空列表 ax.lines,常用的 ax.plot 命令会往这个列表里添加一个 Line2D 对象,并在后台静默地进行相关设置。
x = np.linspace(0, 2 * np.pi, 100)

fig = plt.figure()
ax = fig.add_subplot(1, 1, 1)
ax.tick_params(axis="both", which="major", direction="inout")
print("ax.lines before plot:\n", ax.lines)  # 空的
(line1, ) = ax.plot(x, np.sin(x), label="1st plot")  # 往 ax.lines 里加 Line2D
print("ax.lines after 1st plot:\n", ax.lines)
(line2, ) = ax.plot(x, np.sin(x + np.pi / 8), label="2nd plot")  # 再加一个 Line2D
print("ax.lines after 2nd plot:\n", ax.lines)
ax.legend()
print("line1:", line1)
print("line2:", line2)
ax.lines before plot:
<Axes.ArtistList of 0 lines>
ax.lines after 1st plot:
<Axes.ArtistList of 1 lines>
ax.lines after 2nd plot:
<Axes.ArtistList of 2 lines>
line1: Line2D(1st plot)
line2: Line2D(2nd plot)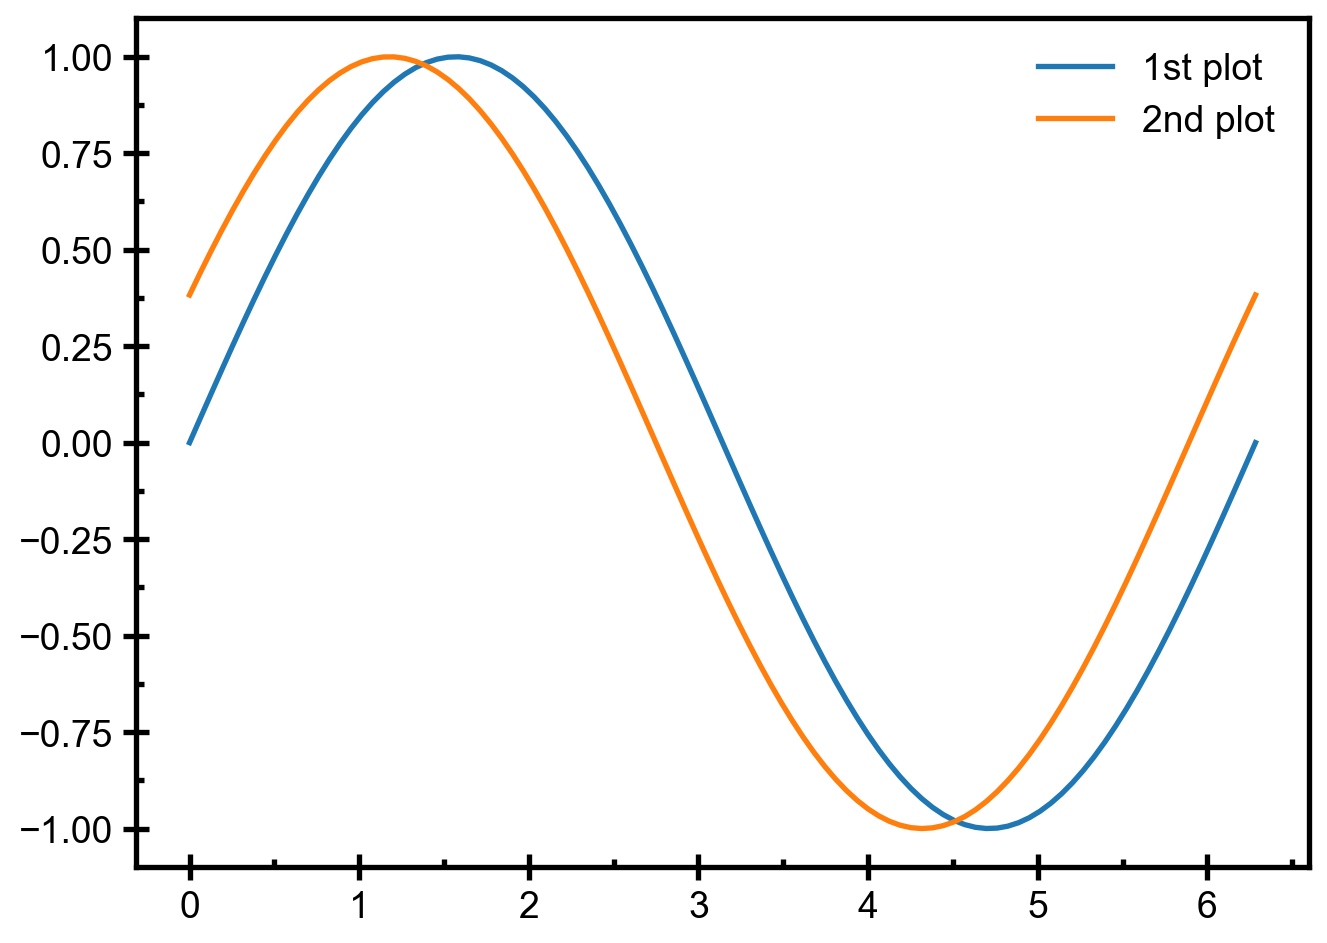
接下来概述一下这四种容器:
Figure 属性 |
描述 |
|---|---|
fig.axes |
含有 Axes 实例的列表(包括 Subplot) |
fig.patch |
用作 Figure 背景的 Rectangle 实例 |
fig.images |
含有 FigureImages 补丁(patch)的列表——用于显示 raw pixel |
fig.legends |
含有 Figure Legend 实例的列表(区别于 Axes.legends) |
fig.lines |
含有 Figure Line2D 实例的列表(很少用到,详见 Axes.lines) |
fig.patches |
含有 Figure 补丁的列表(很少用到,详见 Axes.patches) |
fig.texts |
含有 Figure Text 实例的列表 |
复数名的属性是列表,而单数名的则代表单个对象。值得注意的是属于 Figure 的 Artist 都默认使用 Figure 坐标,它 可以通过 Transforms 转换为 Axes 或数据的坐标,不过这个话题就超出本文的范围了。
5 fig.legend and ax.legend
通过 fig.legend 方法 可以添加图例(legend),而 fig.legends 就是用来装这些图例的”盒子”。你可能会说”这有什么用?我们已经有了 ax.legend 啊。“区别在于二者的作用域不同,ax.legend 只会从属于 ax 的 Artist 里收集标签(label),而 fig.legend 会收集 fig 旗下所有 Axes 里的标签。举个例子,当你用 ax.twinx 画图时,单纯调用 ax.legend 只会创建出两个独立的图例,这通常不是我们想要的效果,这时 fig.legend 就派上用场了。
x = np.linspace(0, 2 * np.pi, 100)

fig = plt.figure()
ax = fig.add_subplot(111)
ax.plot(x, np.sin(x), label="sin(x)")
ax.tick_params(axis="both", which="major", direction="inout")
ax1 = ax.twinx()
ax1.plot(x, 2 * np.cos(x), c="C1", label="2*cos(x)")
ax1.tick_params(axis="both", which="major", direction="inout")
# cf. 'CN' 形式的记号
# https://matplotlib.org/stable/tutorials/colors/colors.html#cn-color-selection

ax.legend()
ax1.legend()
<matplotlib.legend.Legend at 0x127faff70>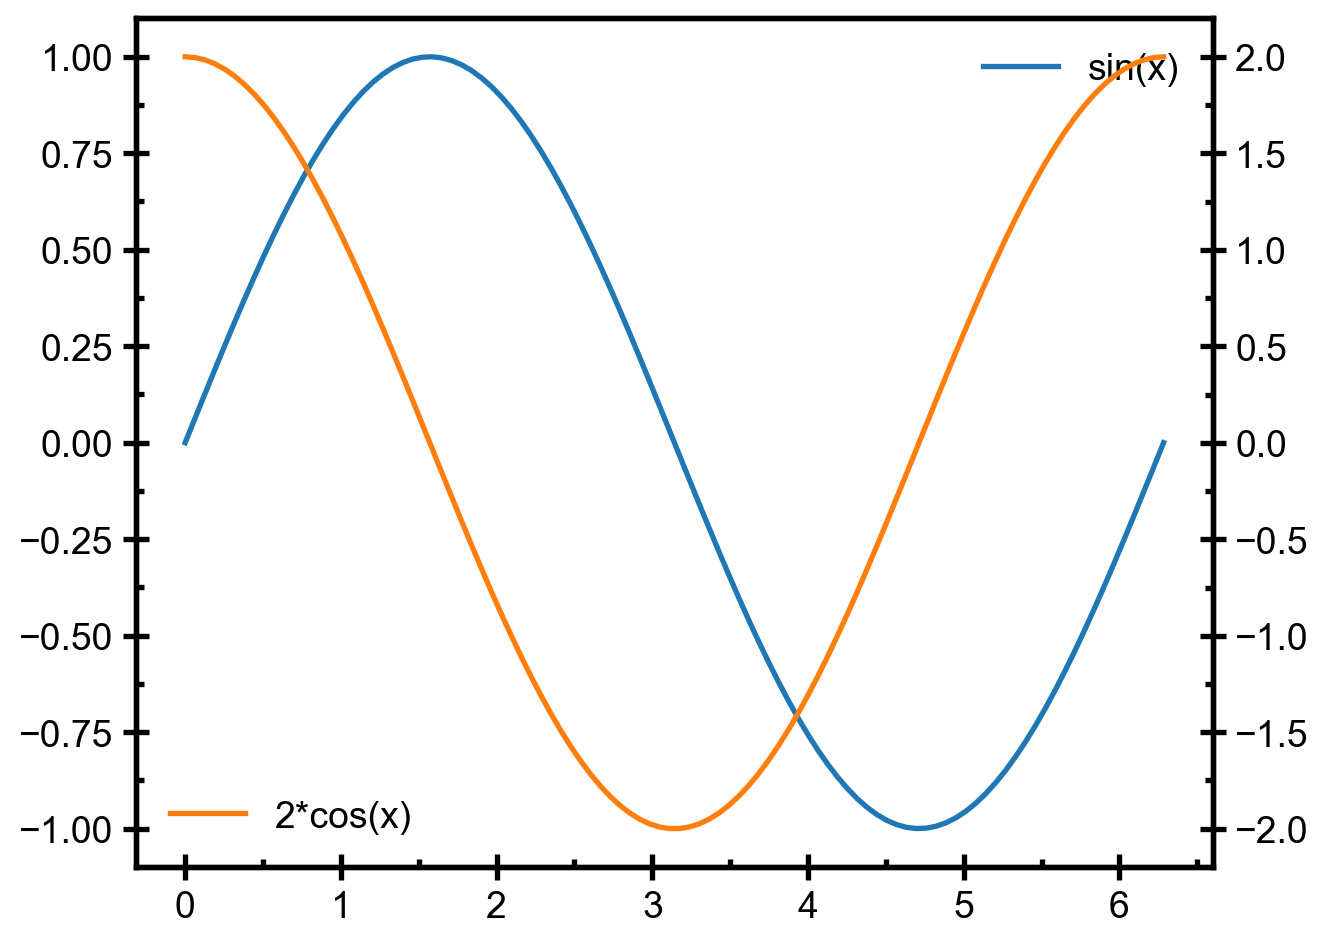
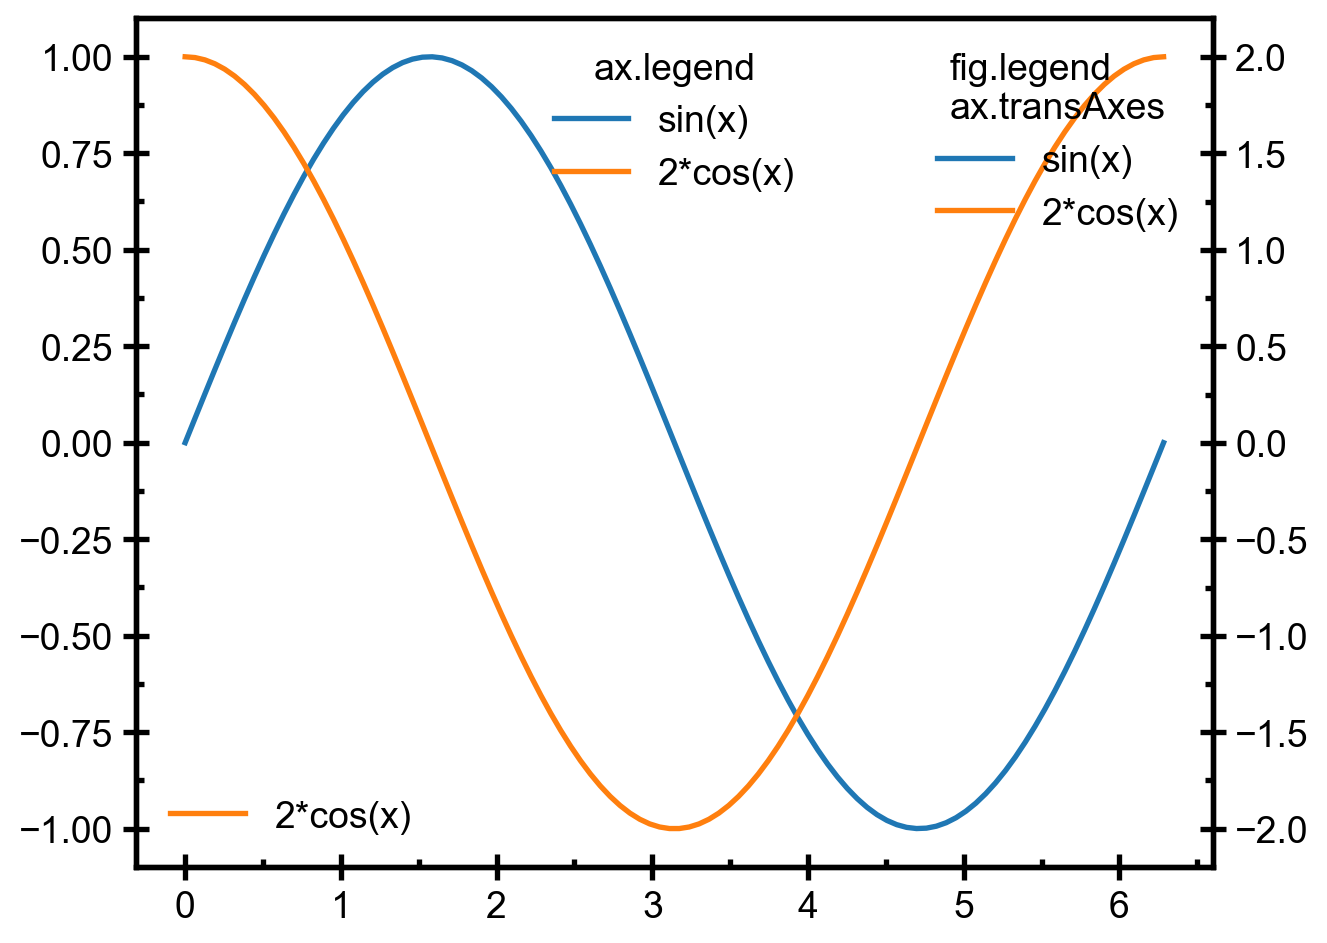
将两个图例合并在一起的经典技巧是,把两个 Axes 的图例句柄(handle)和标签组合起来:
# 在另一个 notebook 里执行这部分以显示更新后的图像
handler, label = ax.get_legend_handles_labels()
handler1, label1 = ax1.get_legend_handles_labels()
ax.legend(handler + handler1,
          label + label1,
          loc="upper center",
          title="ax.legend")
# ax1.legend 创建的图例仍然存在
fig
这个需求可以通过不给参数直接调用 fig.legend 来轻松解决。图例的位置默认使用 Figure 坐标,想把图例放在绘图框里面时会不太方便,你可以指定 bbox_transform 关键字改用 Axes 坐标:
6 Axes
matplotlib.axes.Axes是 matplotlib 体系的核心。
这句话出自 Artist tutorial,说的非常正确,因为在 matplotlib 中数据可视化的重要部分都是由 Axes 的方法完成的。
Axes 属性 |
描述 |
|---|---|
ax.artists |
含有 Artist 实例的列表 |
ax.patch |
用作 Axes 背景的 Rectangle 实例 |
ax.collections |
含有 collection 实例的列表 |
ax.images |
含有 AxesImage 实例的列表 |
ax.legends |
含有 Legend 实例的列表 |
ax.lines |
含有 Line2D 实例的列表 |
ax.patches |
含有 Patch 实例的列表 |
ax.texts |
含有 Text 实例的列表 |
ax.xaxis |
matplotlib.axis.XAxis 实例 |
ax.yaxis |
matplotlib.axis.YAxis 实例 |
常用的 ax.plot 和 ax.scatter 等命令被称为”辅助方法(helper methods)“,它们会将相应的 Artist 放入合适的容器内,并执行其它一些杂务。
| 辅助方法 | Artist |
容器 |
|---|---|---|
ax.annotate |
Annotate |
ax.texts |
ax.bar |
Rectangle |
ax.patches |
ax.errorbar |
Line2D & Rectangle |
ax.lines & ax.patches |
ax.fill |
Polygon |
ax.patches |
ax.hist |
Rectangle |
ax.patches |
ax.imshow |
AxesImage |
ax.images |
ax.legend |
Legend |
ax.legends |
ax.plot |
Line2D |
ax.lines |
ax.scatter |
PathCollection |
ax.collections |
ax.text |
Text |
ax.texts |
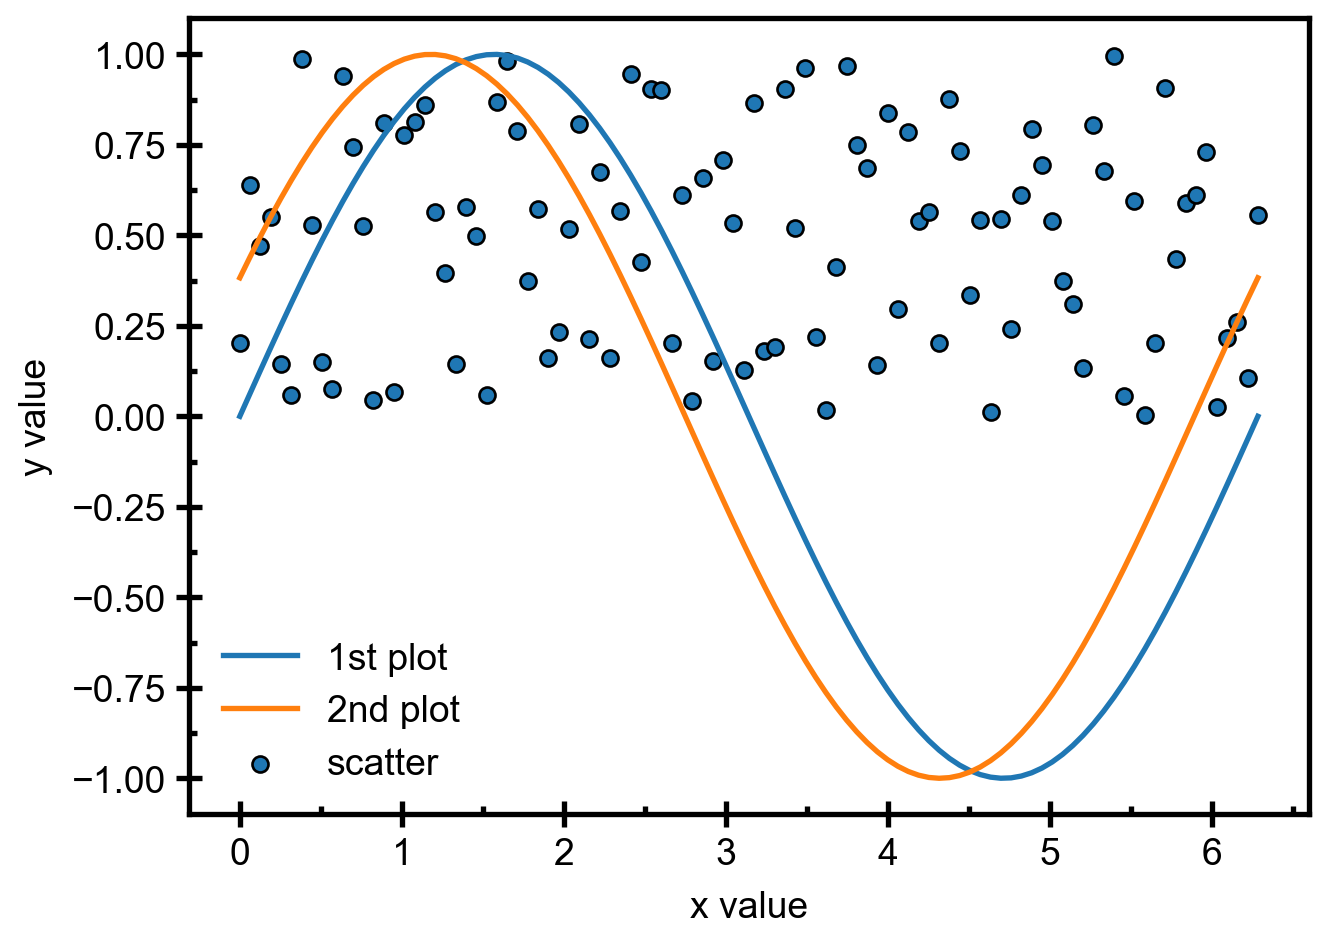
下面这个例子展示了 ax.plot 和 ax.scatter 分别将 Line2D 和 PatchCollection 对象添加到对应列表里的过程:
x = np.linspace(0, 2 * np.pi, 100)

fig = plt.figure()
ax = fig.add_subplot(1, 1, 1)
print("ax.lines before plot:\n", ax.lines)  # 空的 Axes.lines
(line1, ) = ax.plot(x, np.sin(x), label="1st plot")  # 把 Line2D 加入 Axes.lines
print("ax.lines after 1st plot:\n", ax.lines)
(line2, ) = ax.plot(x, np.sin(x + np.pi / 8), label="2nd plot")  # 加入另一条 Line2D
print("ax.lines after 2nd plot:\n", ax.lines)

print("ax.collections before scatter:\n", ax.collections)
scat = ax.scatter(x, np.random.rand(len(x)),
                  label="scatter")  # 把 PathCollection 加入 Axes.collections
print("ax.collections after scatter:\n", ax.collections)
ax.legend()
print("line1:", line1)
print("line2:", line2)
print("scat:", scat)
ax.set_xlabel("x value")
ax.set_ylabel("y value")
ax.tick_params(axis="both", which="major", direction="inout")
ax.lines before plot:
<Axes.ArtistList of 0 lines>
ax.lines after 1st plot:
<Axes.ArtistList of 1 lines>
ax.lines after 2nd plot:
<Axes.ArtistList of 2 lines>
ax.collections before scatter:
<Axes.ArtistList of 0 collections>
ax.collections after scatter:
<Axes.ArtistList of 1 collections>
line1: Line2D(1st plot)
line2: Line2D(2nd plot)
scat: <matplotlib.collections.PathCollection object at 0x127c673d0>